Quality Analytics Reports
The Insights Report for a monitor is a single consolidated view. Reading top to bottom, it is broken down into the following sections:
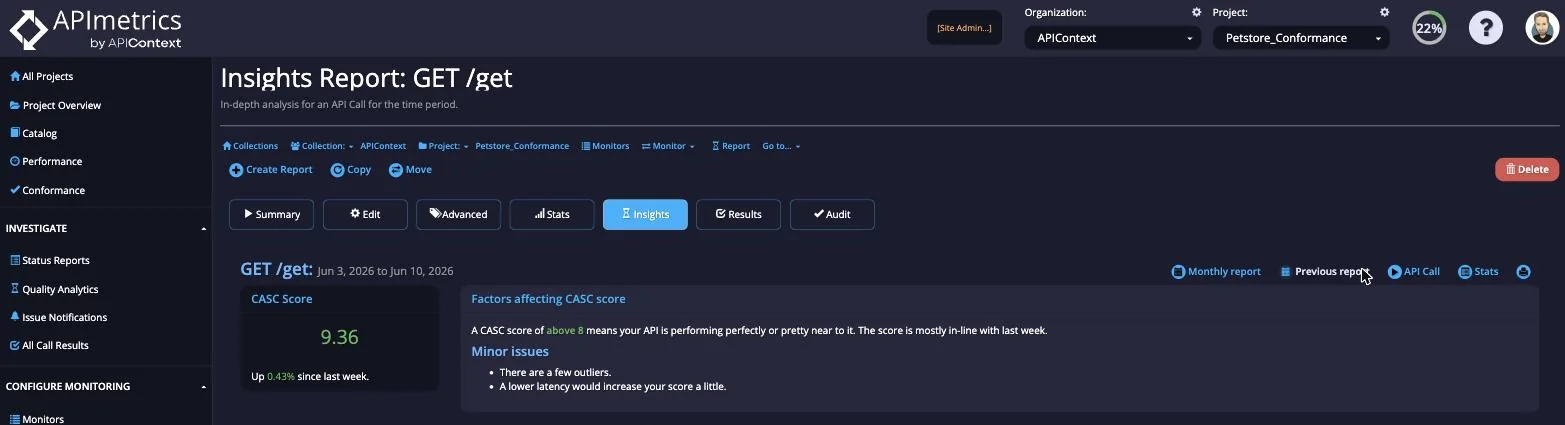
- CASC score - the score for the monitor plus a Factors affecting CASC score panel describing the issues impacting that score
- Pass rates - the Pass Rate and Effective Pass Rate, with the number of API calls analyzed and the estimated downtime
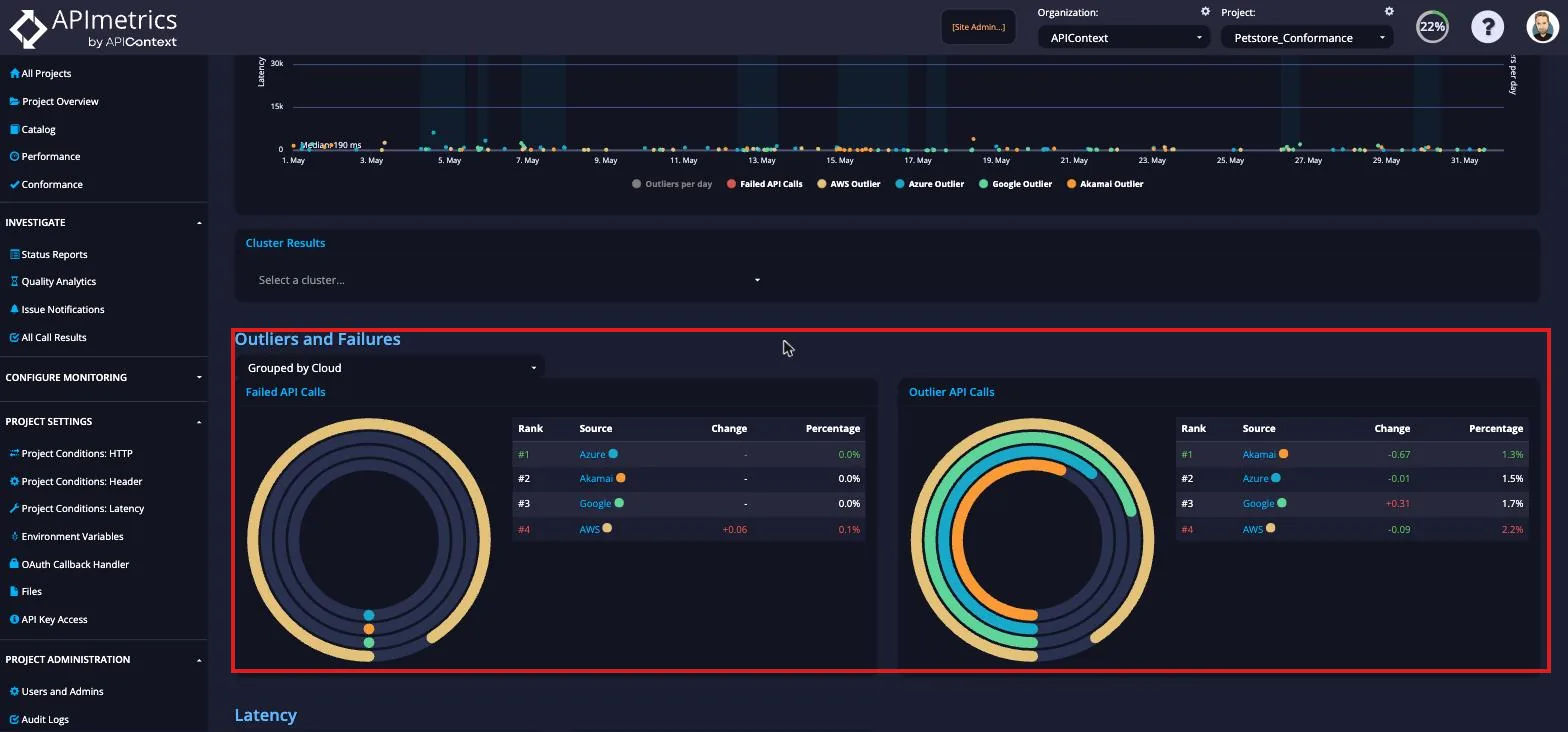
- Outliers and Failures - Most failures and Most outliers broken down by Cloud, Region, Country, and Node
- Latency - Mean Latency, Standard deviation, Slowest locations, and Most variation broken down by Cloud, Region, or specific cloud location

Summary Information
The top of the report shows the CASC score for the monitor next to a Factors affecting CASC score panel. This panel explains the score in context — whether the monitor is performing perfectly or near to it, how it compares to the previous period, and any minor or major issues such as a few outliers or elevated latency. Immediately below, the Pass Rate and Effective Pass Rate summarize how many API calls passed, with the failure and outlier breakdowns following beneath.
Outlier Analysis
The outlier analysis graphically shows latency outliers by type:
- cloud location they occurred
- failures
The light background is an indication of the number of outlying events that day. The lighter shading in the background indicates that a cluster has been detected where the outlying events seem to be related.
The drop down at the bottom of the view allows you to jump straight to a specific outlying result.
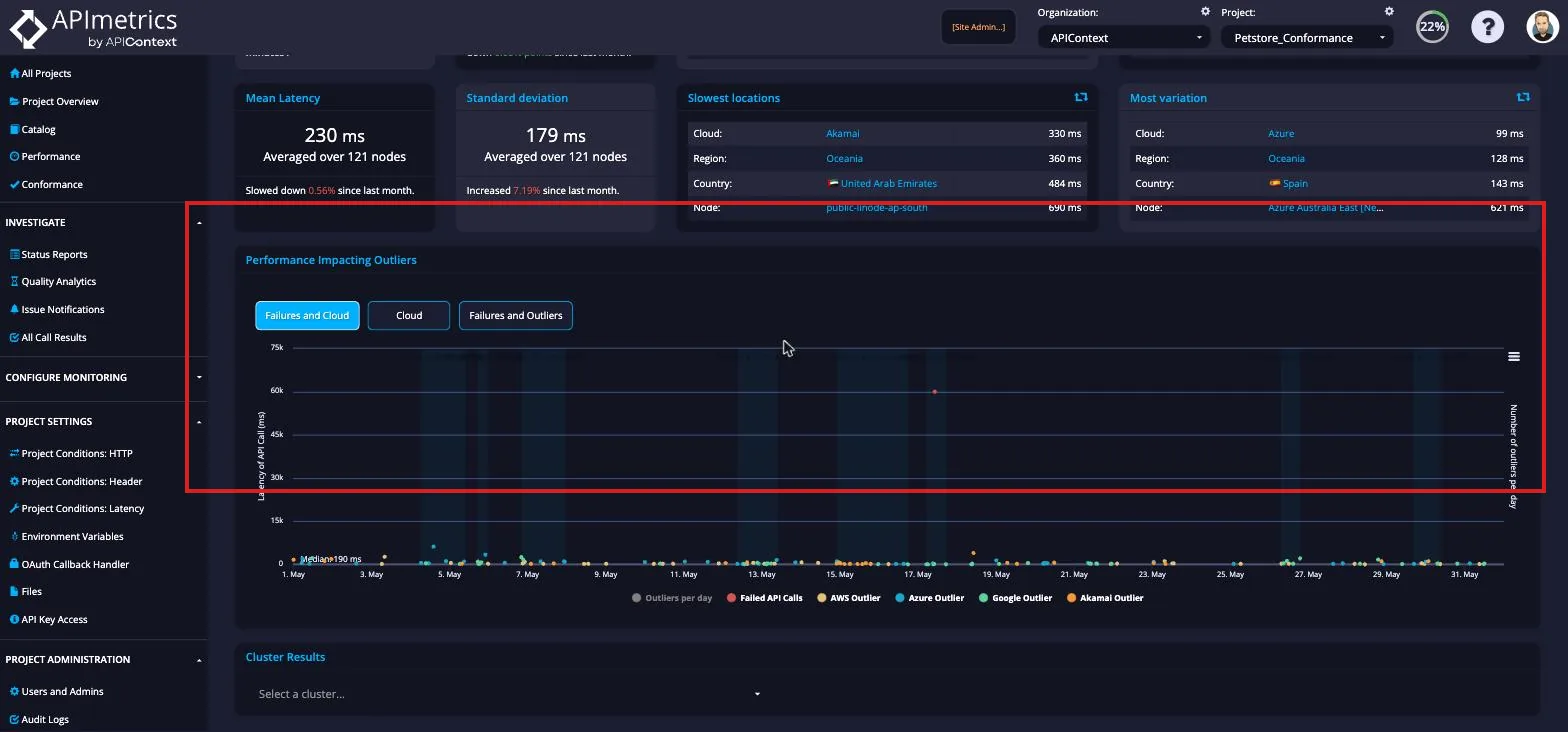
Outlier Incidence
The final set of views can provide you with a comparative view by Cloud, Region or individual cloud location.