Monitor Stats
Key Concepts
APImetrics provides a variety of views of the statistics of each test that allows you to understand at a glance the behavior of each call.
As you deploy API test calls, APImetrics starts logging results. You can get to the stats for a specific test from the Quality Analytics view, a report, the home page, the list of calls or the call edit page.
The statistics for an individual test can be viewed either by all cloud locations by day, month or year, and by individual cloud location.
The views available are:
- global latency analysis showing calls broken down by call portion and percentile
- pass-fail rates - clicking on a day will take you to the filtered results for that day
- latency over time
- latency heatmap
- latency histogram showing distribution of results
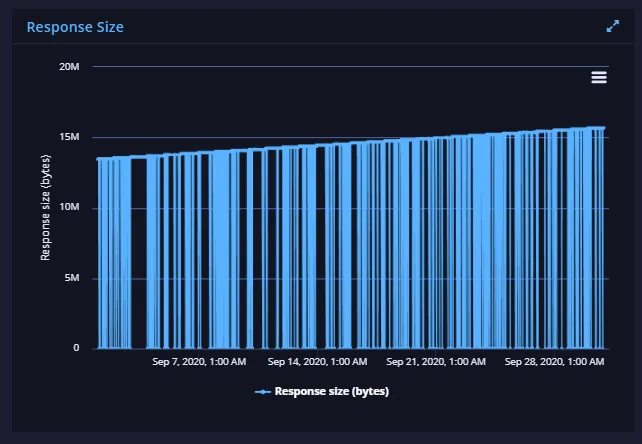
- returned content size - useful for spotting content errors
Clicking on any view will take you to a larger version of it. You can also save latency graphs as reports.

Latency Map
The analysis map gives you a geographical breakdown of total latency (or any specific latency component) by the locations of the data center (cloud location) the calls are being made from. You can zoom in on the map to see what is happening in a particular area more clearly.
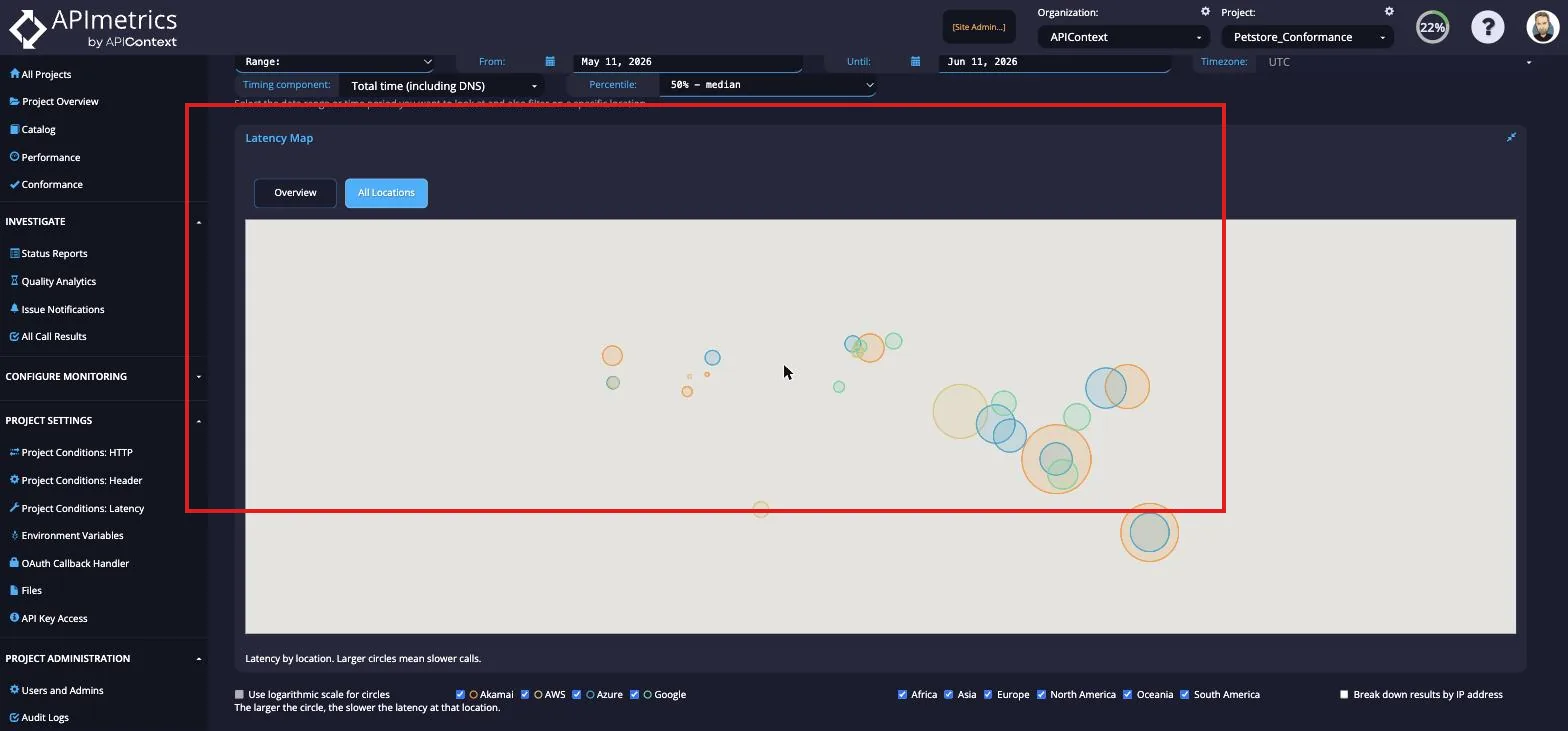
Guide to image:
- The larger a circle, the longer (slower) the call. Smaller circles are shorter (faster). Each circle is color-coded to the cloud it represents
- Metric - pick the monitor latency component you are interested in seeing
- Percentile Picker
- Domain Picker
- IP Address call made to
- Switch to logarithmic circles to make it easier to compare small and large results
- Cloud data center (location) picker
- Region picker
- IP Address - display results by IP address called - use in conjunction with 5)
Pass/Fail

The Pass/Fail views gives you a quick overview of how the call has been behaving over the last few weeks. A green box indicates that there were no failures during that day. A red and green box indicates there were some failures during that day as well as passes. A red, yellow and green box indicates that there were some failures and warnings during that day as well as passes.
Latency Graph

The latency graph shows how the average latency has varied over the last few weeks.
Latency Heatmap

Latency Histogram

Response Size